What is an Infographic?
As far as I can tell from the research, I have done infographics are a visual representation of data or different information. They can be used to represent what might be seen as an abstract or difficult to understand concepts and simplify the material. We see these quite a bit in everyday life whether that be online, during presentations or lectures at school as well as on bulletin boards around school. They are a flashy way to catch a reader’s attention and display different types of data.
I believe this could be extremely useful in the classroom. As I said above, they are flashy and visual so students will love this. I believe that anything visual helps students comprehend the materials a little bit more, so displaying this at the beginning of the unit to show the different topics you are going to cover, or using it to show different animals that have similar ecosystems could be a great benefit to students who might need that little bit of visual aid with the written information.
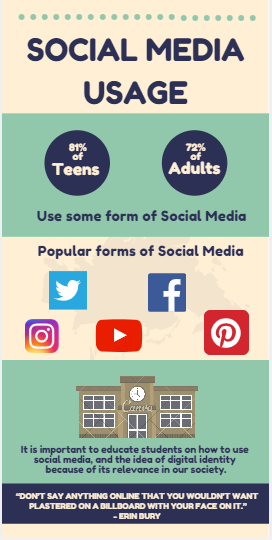
Another awesome idea could be to have students create their own maybe based on a science unit such as different animals or ecosystems. By creating an infographic, students could demonstrate their knowledge in the subject area while expressing their creative side. I believe this could be a great way to review before an assessment or could even be used as an assessment! I tried my hand at creating my own and it is quite easy, there are awesome templates and symbols that are accessible through the website I used! So here is my infographic based on social media usage!